Machine data acquisition to increase production output

Advantages at a glance

ai

Comprehensive machine data acquisition

time-machine

Meaningful OEE analysis

OTIF

Integrated action and measure management

Shorter response time during machine downtimes

savings

Improvement in overall equipment effectiveness

whistle-1

Simplification of internal communication and collaboration

Maintenance costs often explode because the actual causes of machine downtime are not rectified. Subsequently, downtime losses due to overtime or additional reserve capacity have to be made up. Legato Sapient analyzes every process step in real time so that you can tackle the actual causes of downtime in the long term. Machine data acquisition allows you to systematically analyze OEE and aggregate the values into meaningful key figures, such as OEE (Overall Equipment Effectiveness), MTTR (mean time to repair) or MTBF (mean time between failures).

TopX evaluations of machine downtimes and their causes reveal potential for improvement, which can be successively processed. The causes of problems can be tracked and eliminated directly via the integrated action control system – in line with the continuous improvement process (CIP). This means that your day-to-day business will in future be determined by preventative action and no longer just by problem-driven reaction.

Machine data acquisition that creates business value

Production KPIs create transparency. The module of our MES software solution Legato Sapient enables automatic calculation and aggregation of information. The insights generated in this way allow you to identify and resolve process deviations more quickly. Simplify your action management with an OEE analysis.

By using our software solution, you can achieve an increase in production of at least 3% – a result that can generate additional millions! The increase in overall equipment effectiveness is based, for example, on the reduction of response times in the event of a malfunction. In this way, you increase plant availability.

Real-time monitoring of buffer levels and system interlinking also enables you to avoid idle times and further increase output. An optimized cycle time saves further valuable minutes that contribute to increased production.

Legato Sapient: Your system for long-term improvement of output and overall equipment effectiveness

As an information basis for OEE data acquisition, we connect both homogeneous and heterogeneous machine parks via various communication variants. It is irrelevant which manufacturer your production machines come from – over 2,000 machines can be docked to one system!

The recorded data is then aggregated into meaningful key figures, such as output, quality rate, machine availability, MTTR, MTBF and many more. Target and limit values can be defined for each KPI, so that the actual status can be constantly monitored against the target value. All information can be accessed via a standard web browser. For the best possible understanding, both tabular and graphical evaluations are available for displaying the key figures.

Our software solution enables you to evaluate downtimes. By successfully eliminating the causes of faults, you can avoid recurring faults in the long term.

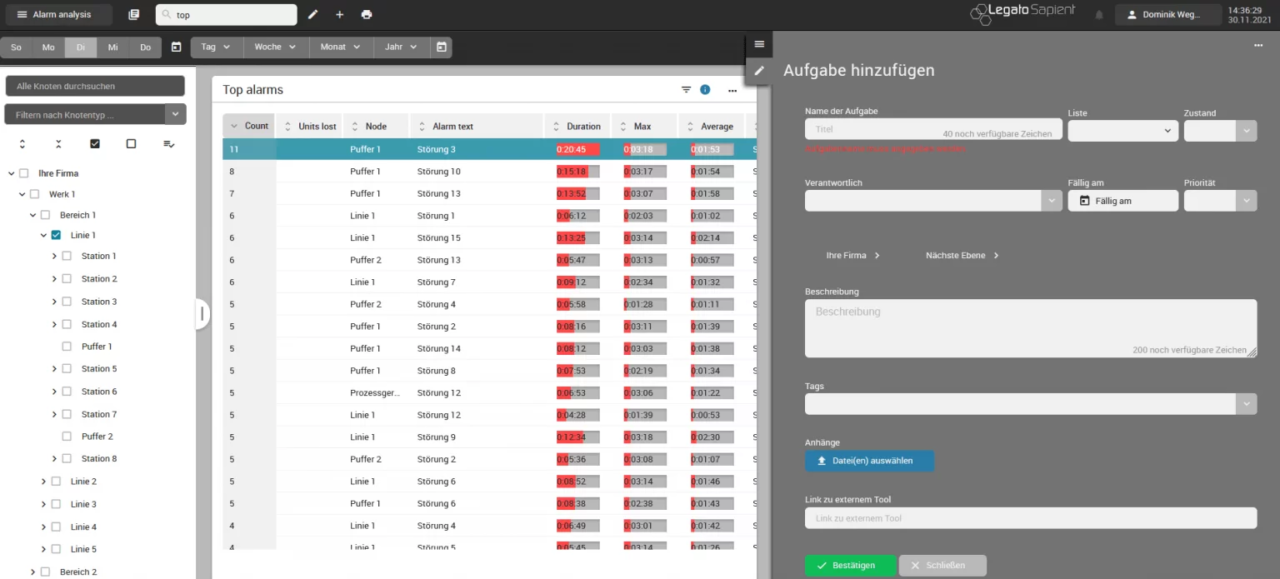
Our software also offers dedicated action and measure management. Work systematically and continuously on various tasks, such as the sustainable avoidance of recurring faults described above. To do this, you can create measures for various events directly in the system, which can then be tracked with due dates and responsibilities in line with the CIP. This considerably simplifies communication and collaboration within the team, as everyone has an overview of the measures and various subtasks can be assigned to the relevant experts. Use the information for store floor management and the morning meeting so that the depth of information is also increased here.

Click demo in the OEE analysis

According to the motto “many roads lead to Rome”, Legato Sapient has various starting points for improving overall equipment effectiveness in the long term.

Visualization of actual and target quantities

grey-1

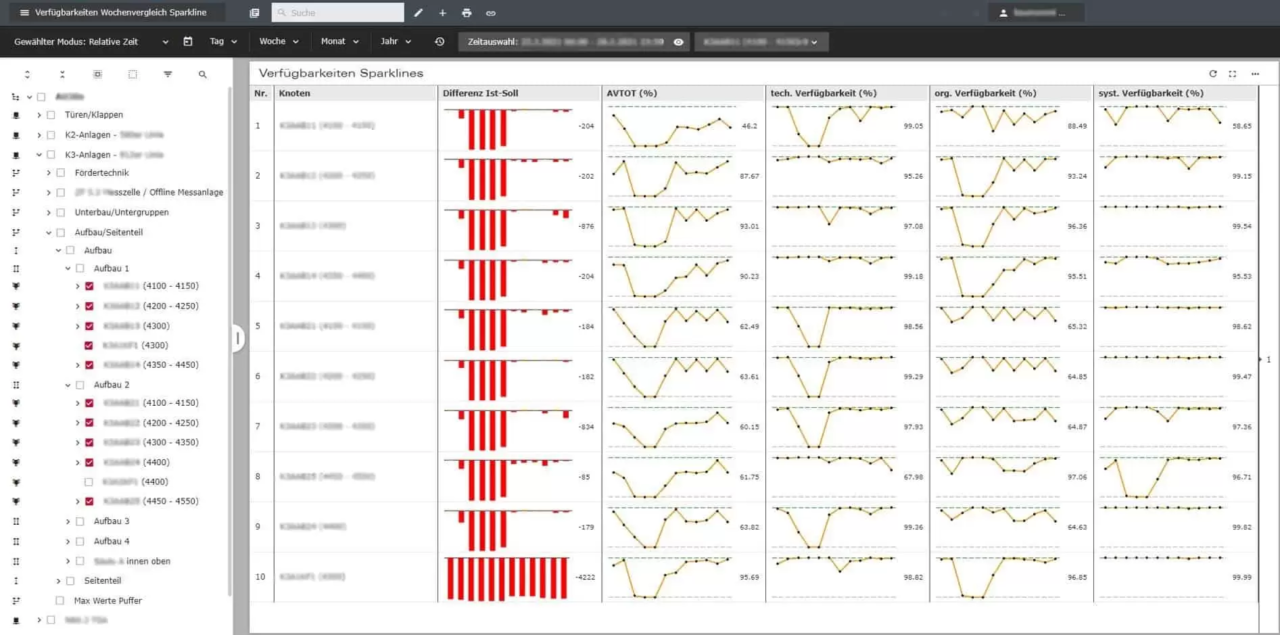
It is often started by looking at meaningful KPIs such as the production efficiency of an area or the plant availability. In the following screenshot, several areas or systems can be compared with each other via “Multiselect”. In this case, the output (actual vs. target quantity) and availabilities (total, technical, organizational and system-related) are compared.

This comparison allows the “weakest” systems or areas, i.e. the “bottle necks”, to be identified. Based on this, a more in-depth analysis of the causes is then carried out. The typical fault evaluations, such as TopX faults, are used here. Determine the main causes and take preventive measures in the CIP.

grey-1

Visualization of limit and target values

grey-1

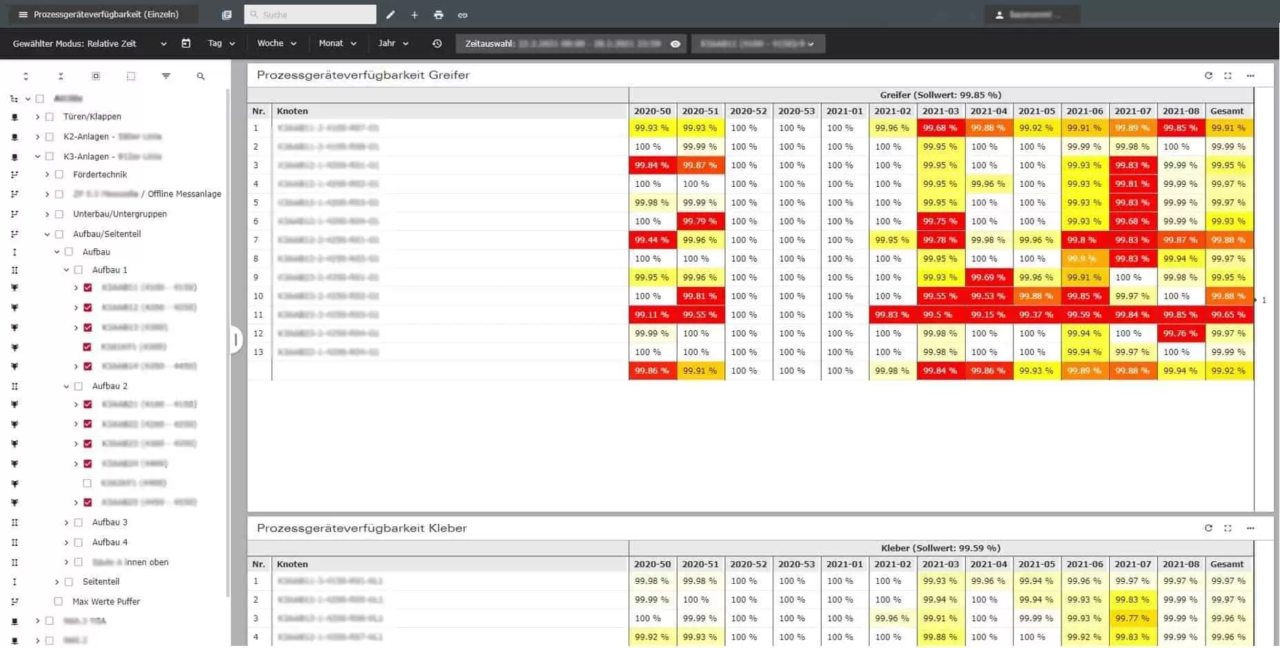
An alternative view is shown in the following screenshot – here, availability values below a defined limit/target value are automatically colored, allowing you to identify the critical fields of action even more quickly.

This view also serves as the basis for a more in-depth evaluation of the causes, typically using fault evaluations such as TopX evaluations.

grey-1

Identification and management of top disruptions

grey-1

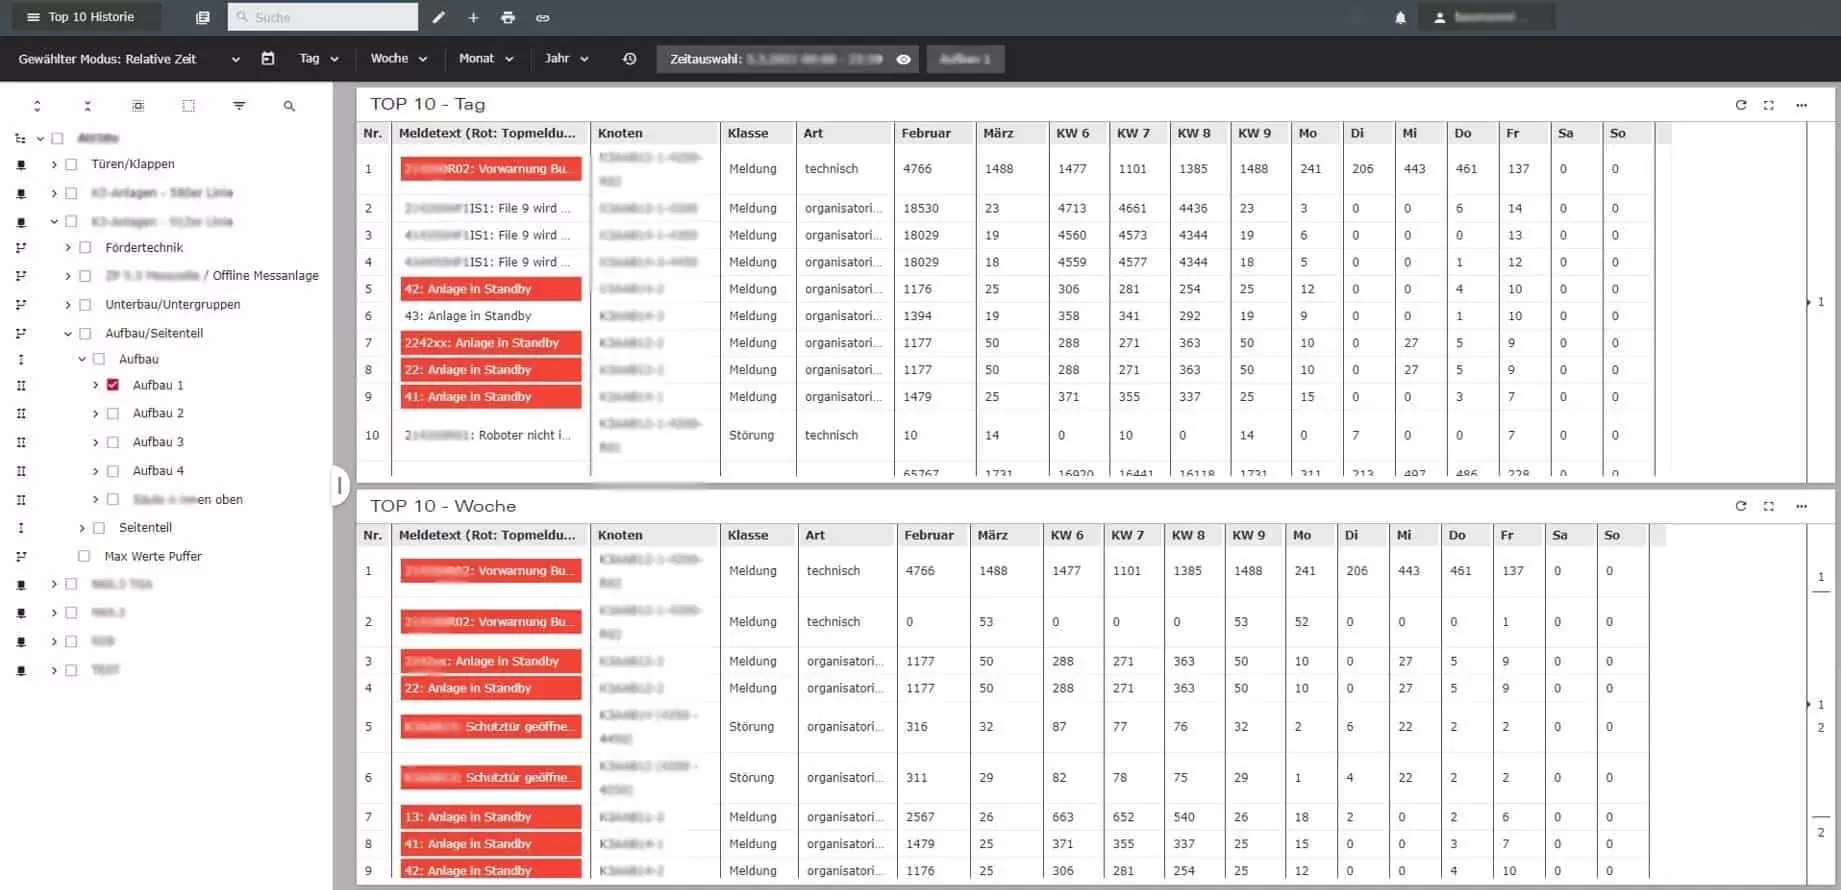
The following screenshot shows such a TopX evaluation – the faults shown in red were identified as particularly relevant, as they have been appearing as top faults over a longer period of time.

grey-1
grey-1

Typically, you start with the fault that has the greatest impact on downtime or availability. In action management, a corresponding action with responsibility and target date is defined and processed. The “second most important” fault is then dealt with in the same way.

grey-1
grey-1

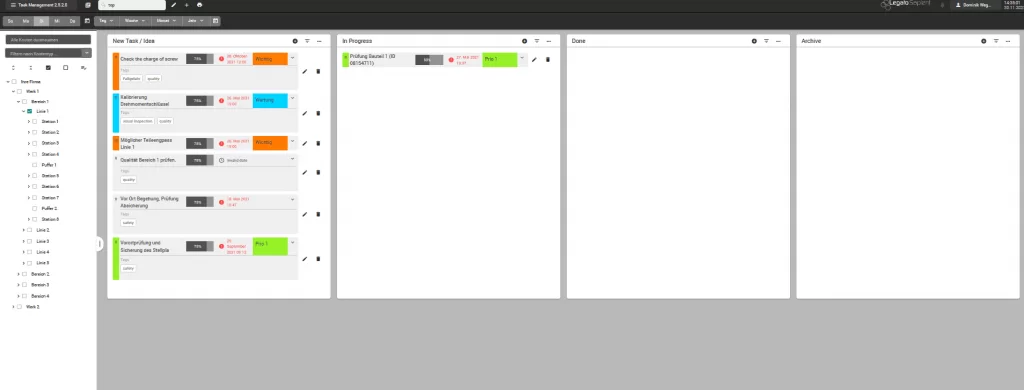
A typical representation, a Kanban board, of all open measures is shown in the following screenshot:

grey-1

Input/Output: Reconstruction of the number of rejects

grey-1

To increase output, it is of course also essential to keep the number of rejects low.
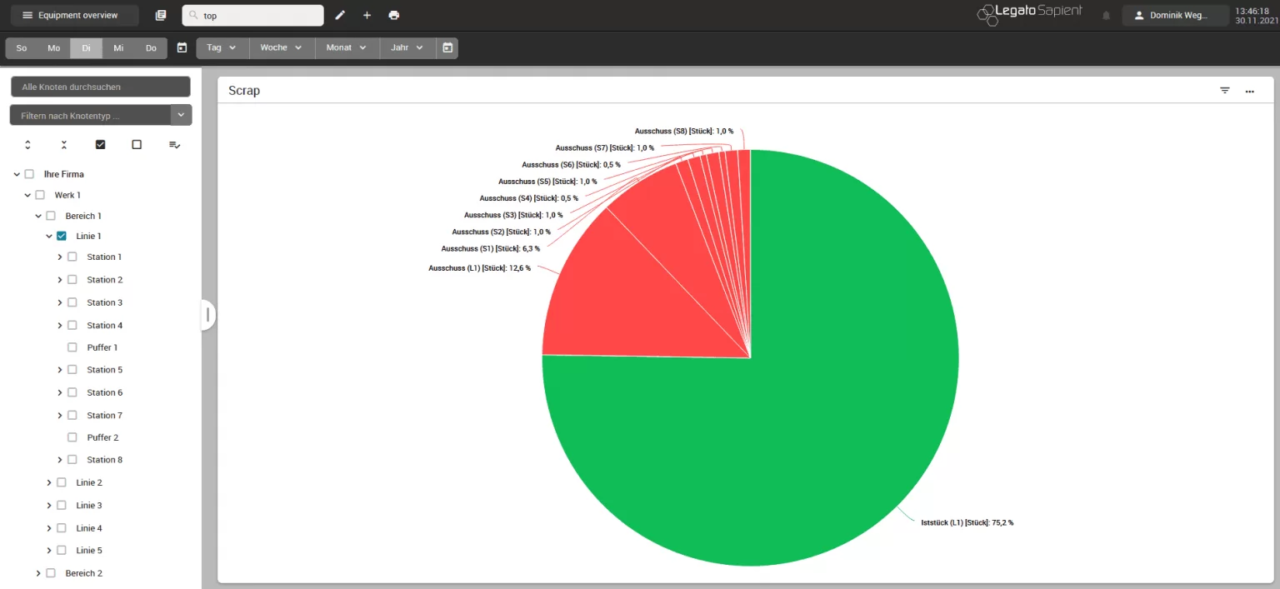
The following screenshot shows the ratio of scrap and input/output quantities.

grey-1
grey-1

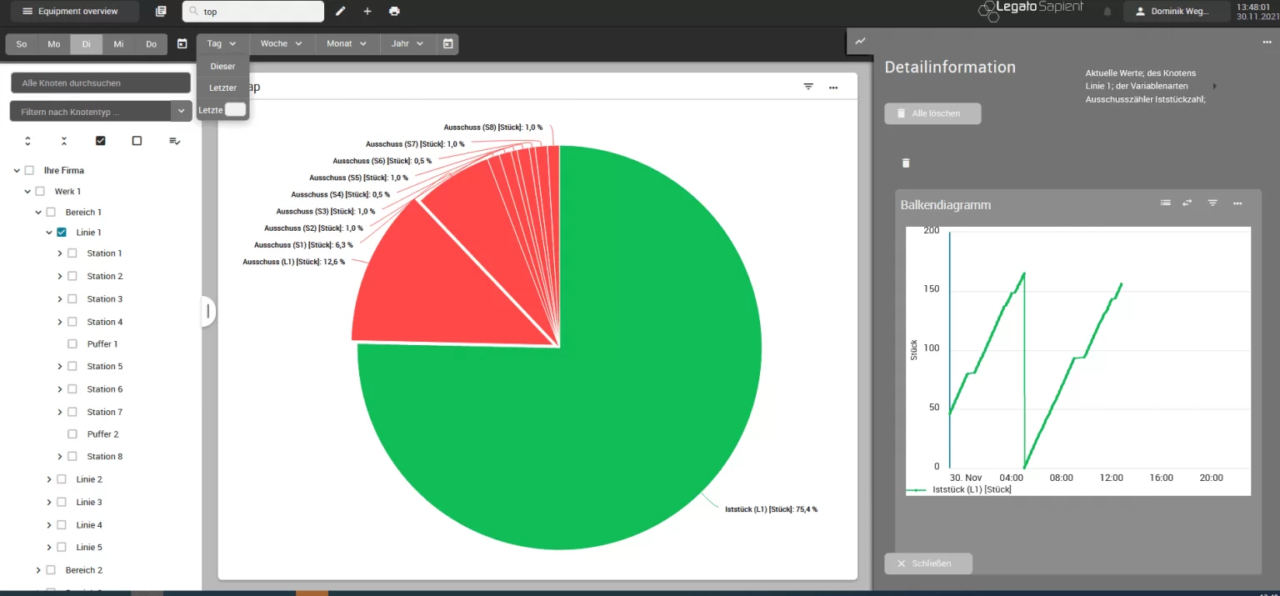
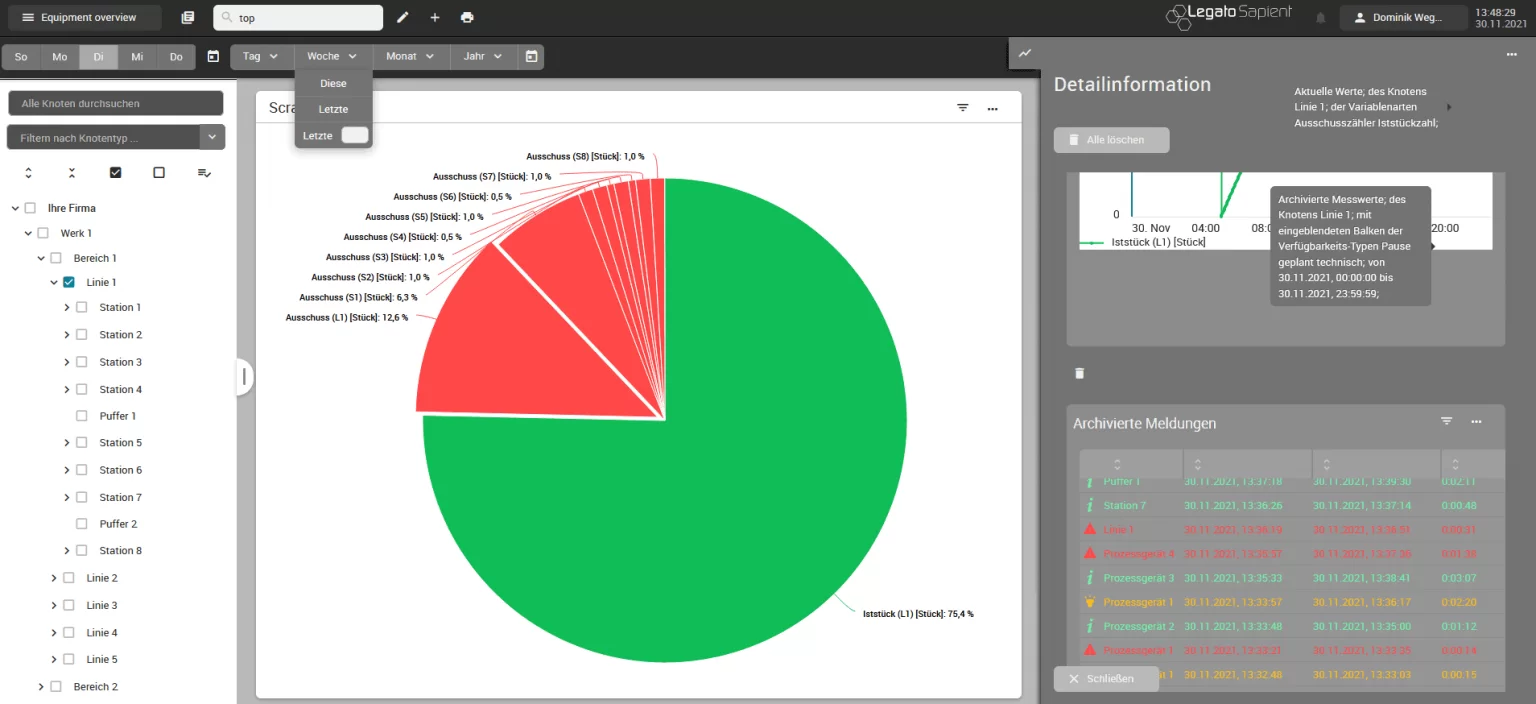
You need to know the causes of the rejects in order to take further action. By clicking on a red piece of cake and a menu via the 3 dots at the top right, the corresponding piece count history opens in the sidebar.

grey-1
grey-1

Display the number of pieces via the scrap quantities. This can then be used to drill down further to the associated faults. The main causes (faults) are then fed back into action management by creating an action.

grey-1

Further key figures for production data analysis

grey-1

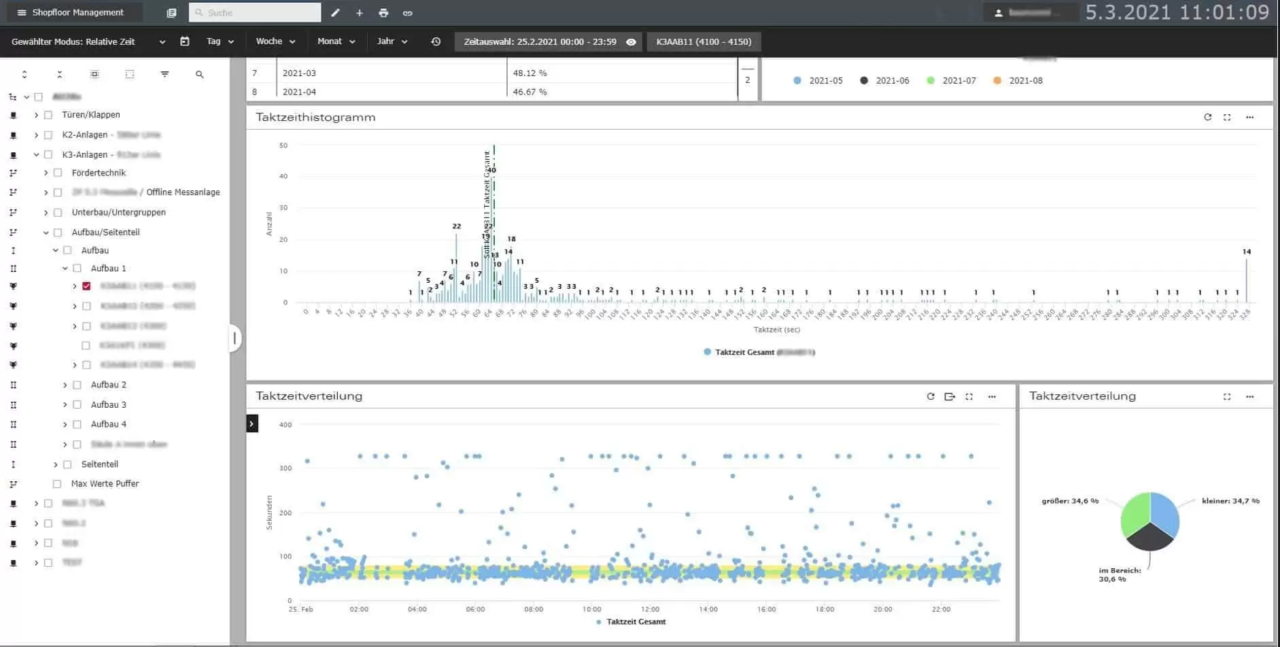
In addition to availability and quantities, other key figures are used to increase overall system effectiveness. The following example shows a typical illustration that helps to detect faults in the process. In the lower area, each point represents a cycle time – all points that are not in the green-yellow band are cycle time overruns above the limit values. In each case, there are faults in the process.

As part of the further production data analysis, the diagram is “zoomed” into the affected time range. The 3 dots at the top right of the boardlet can then be used to take a closer look at the respective fault messages for the affected time range.

grey-1

FAQ: Important questions about OEE analysis

What is meant by OEE?

Overall Equipment Effectiveness (OEE) is the key performance indicator used by manufacturing companies to measure output. It is a summary of the subordinate key figures availability, performance and quality. Ideally, the target rates would be achieved in the available time without rejects. The OEE value would then be 100%. In reality, OEE values between 65% and 85% are considered good.

What are the benefits of using machine data acquisition software for your company?

Comprehensive machine data acquisition allows you to optimize output at various levels. On the one hand, the real-time data allows you to shorten response times when downtimes or malfunctions occur. Secondly, you can identify top faults in the historical data history and eliminate the causes. Last but not least, digital machine data acquisition simplifies communication and task distribution within the team.OEE is the abbreviation for Overall Equipment Effectiveness. In German, the abbreviation GAE is also used for overall equipment effectiveness. The OEE value is made up of the product of three factors:

  • Plant availability,
  • performance (degree of utilization) and
  • quality

It theoretically ranges between 0% and 100%.

What role does the OEE analysis play in the CIP?

Analyzing the OEE in your company allows you to introduce continuous change processes (CIPs) and thus sustainably increase overall equipment effectiveness. By using the data history to detect failures at an early stage and plan preventive maintenance measures, you can optimize your output and work together proactively instead of just reacting to faults.

Get in touch!

Would you like to know more about our solutions? Then please write me using the contact form. I will get back to you as soon as possible.

Dominik Weggler
Sales Team Germanedge

Quick Search. Find more, search less.
Top results
Show all results
No results